SPX call wall and put wall: what they are and how to read them
Updated October 26, 2026
On any trading day, thousands of SPX options that expire the same afternoon (0DTE) change hands. They don't spread evenly across strikes: a few strikes collect far more activity than the rest. The two that matter most around the current price are the call wall and the put wall.
What the call wall and put wall are
- Call wall: the strike at or above the SPX price with the most call activity today.
- Put wall: the strike at or below the price with the most put activity today.
"Activity" means contracts traded today (volume) by default. Open interest — contracts still open from earlier days — is the other common measure; more on that below.
Why traders watch them
A strike where a large number of contracts sits is a strike that a lot of money cares about. Market makers who took the other side of those trades hedge them in the underlying, and that hedging can slow the index as it approaches a heavy strike, pin it there late in the day, or speed it up once the strike gives way. That's why many traders use the call wall as a ceiling to watch and the put wall as a floor to watch.
They are places to pay attention, not guarantees. Price can walk straight through a wall, and walls themselves move as the day's volume builds.
Volume or open interest?
Open interest is published once a day, before the open. For options that expire today it can't show the positions being built today — and on many days most 0DTE activity is exactly that. Today's volume can. Index Viz uses volume by default and switches to open interest in one click (the Vol | OI toggle), so you can compare the two.
How walls move during the day
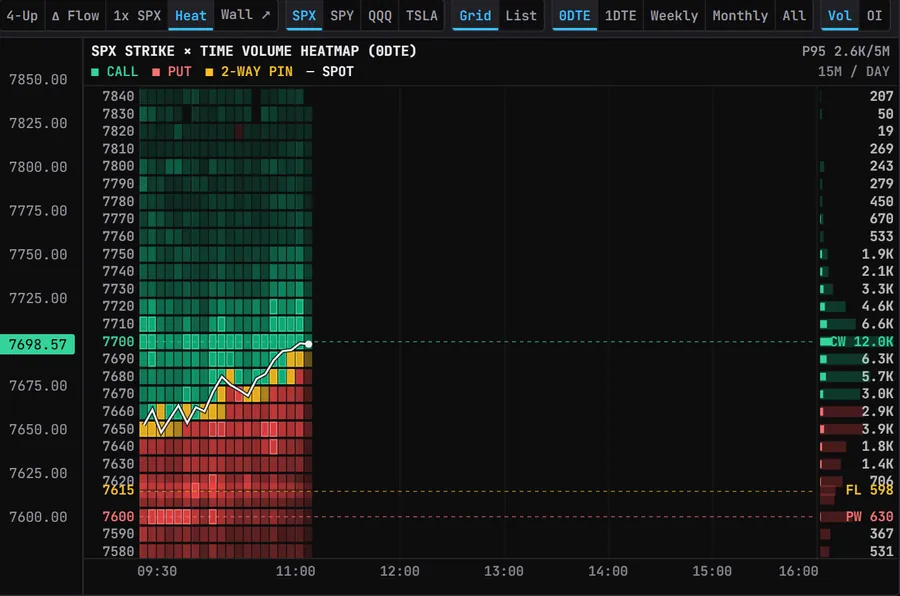
A wall at 10:00 isn't always the wall at 15:00. When fresh volume piles into a new strike, the wall moves there. A strike × time heatmap shows this directly: each cell is the volume traded at one strike in one 5-minute bucket, so you can see where today's activity landed and when.
How to read them in Index Viz
- On the SPX chart, as labelled lines (7700 CALL WALL, 7600 PUT WALL).
- In the options ladder for SPX, SPY, QQQ and a fourth ticker, tagged CW and PW.
- In the heatmap above: calls in green, puts in red, the price path drawn over the 09:30–16:00 grid.
Common mistakes
- Treating a wall as a promise instead of a level to watch.
- Reading open interest on a 0DTE chain and missing today's positions.
- Mixing expiries: the weekly or monthly wall can sit at a different strike from today's.