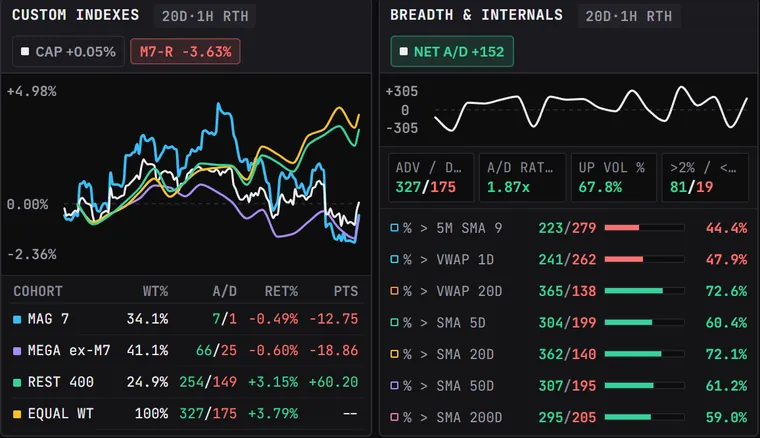
S&P 500 market breadth today: advance/decline, up volume and moving averages
Updated October 26, 2026
The S&P 500 is cap-weighted: its largest companies move it most. Breadth asks a different question — how many of the 500 stocks are taking part. A rally where most stocks rise is built differently from one carried by a handful of giants.
The main breadth measures
- Advancers / decliners (A/D): how many members are up and down on the day, and the ratio between them.
- Net A/D: advancers minus decliners, traced through the session.
- Up-volume share: the share of the day's volume in rising stocks.
- Stocks beyond ±2 %: how many are making big moves either way.
- % above a moving average: the share of members above their 5-minute 9-bar average, today's VWAP, the 20-day VWAP, and their 5-, 20-, 50- and 200-day averages.
How to read it
- Index up, breadth strong: a broad advance — most stocks agree with the index.
- Index up, breadth weak: a narrow rally — a few heavyweights doing the work. It can continue, but it rests on fewer legs.
- Short-term vs long-term: % above today's VWAP moves within minutes; % above the 200-day average changes over months. Reading them together separates a day's swing from the trend.
- Extremes: when advancers outnumber decliners 3 to 1 or more, Index Viz flags a breadth thrust; 1 to 3 or worse, a washout.
Cap-weighted vs equal-weight
Comparing the cap-weighted return with an equal-weight version of the same 500 stocks is another breadth check: when equal-weight lags far behind, the index is leaning on its largest names. Index Viz shows both side by side, plus the MAG7, the next-largest stocks, and the remaining 400 as separate curves.